Performance MarketingArticle6 min read
Performance marketing beyond ROAS: measuring CAC, conversion rates, lead quality and incremental growth
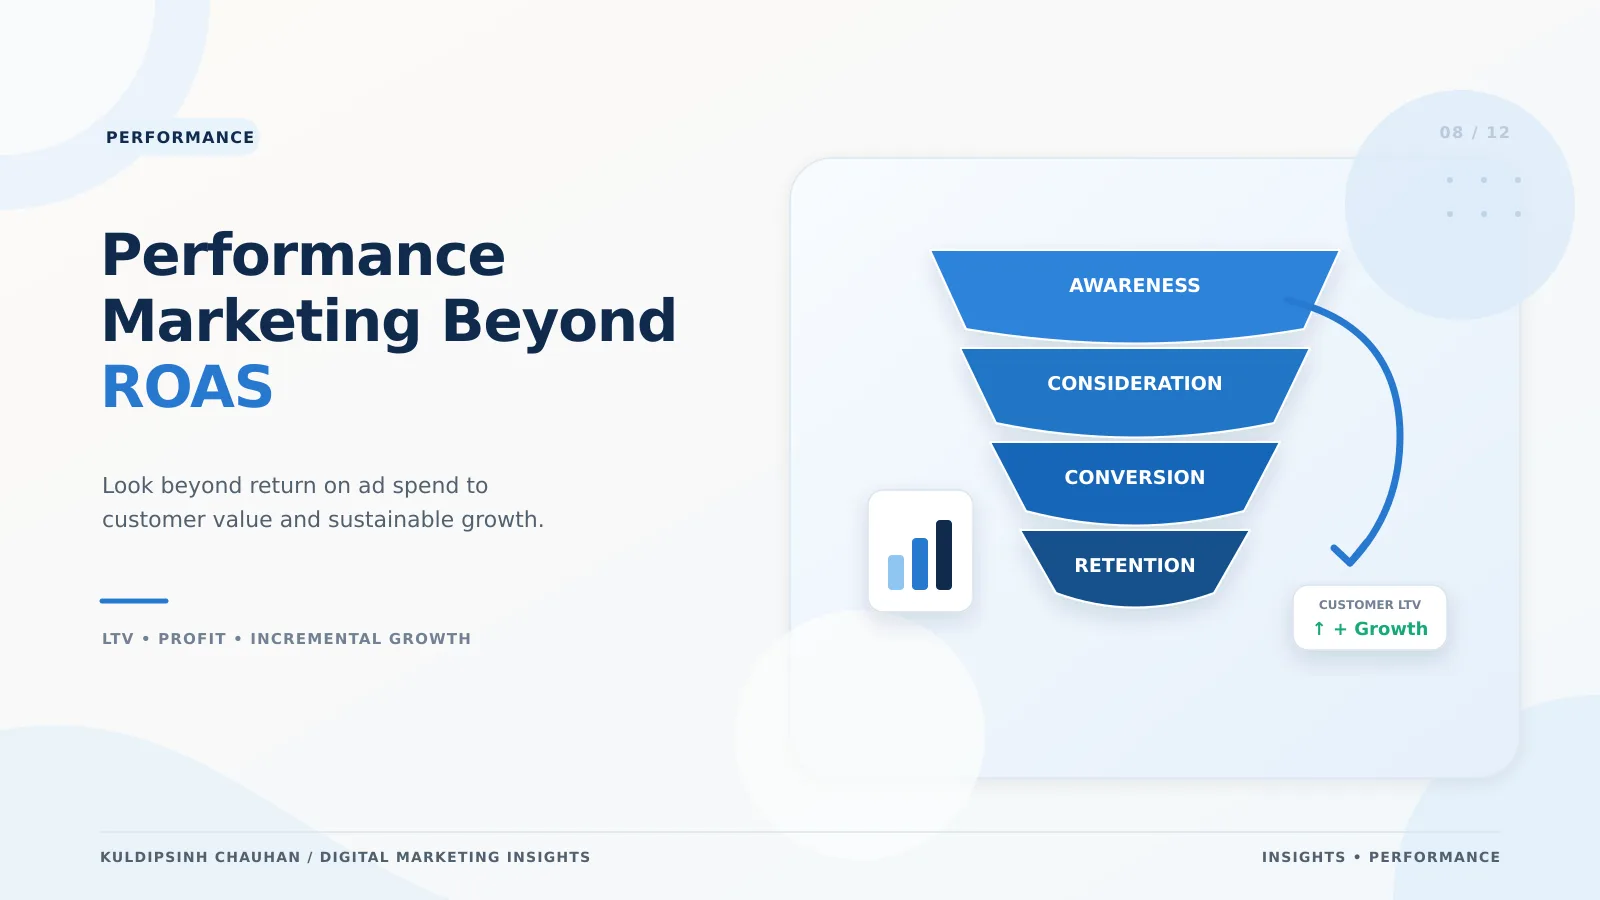
A high ROAS can hide unprofitable growth. These are the metrics that tell you whether paid media is actually building the business.

Why ROAS is not enough
ROAS is attributed revenue divided by ad spend. It is a useful bidding signal, but as a business metric it has blind spots:
- It uses revenue, not profit. A 4x ROAS on a product with 20% margin loses money once other costs are included.
- Brand and retargeting campaigns often show high ROAS because they capture people who were already going to buy.
- Attribution windows and models change the number without changing reality.
- It says nothing about whether the customer returns.
The metrics that complete the picture
Break-even ROAS
Break-even ROAS = 1 / contribution margin. Illustrative example: with a 40% margin after product, shipping and fees, break-even ROAS is 2.5. Anything below that loses money on the first order.
CAC and payback
CAC = total acquisition spend / new customers acquired. Compare it with first-order margin and with expected margin over 6 or 12 months to see how long payback takes.
New vs returning customers
Split revenue by new and returning customers. Growth that comes mainly from existing customers may not need paid acquisition at all.
Conversion rate by stage
Track click to lead, lead to qualified, qualified to sale. A drop at one stage tells you where to fix - ads, landing page, sales follow-up.
Lead quality
For lead generation, define a qualified lead with the sales team and import it as a conversion so bidding can learn from it, as described in Google Ads in 2026.
Measuring incrementality
Incrementality asks: what would have happened without the ads? Ways to test it:
- Conversion lift studies offered by Google and Meta, which compare exposed and holdout groups.
- Geo tests: pause or increase spend in matched regions and compare.
- Brand search holdouts: pause brand campaigns briefly where organic rankings are strong and measure total brand clicks.
- Marketing mix modelling for larger budgets across many channels.
Run tests long enough to reach meaningful volume and avoid major seasonal periods. Treat results as directional and repeat them.
A simple performance scorecard
- Spend and revenue by channel, with new vs returning split.
- CAC and contribution margin per new customer.
- Blended efficiency: total revenue / total marketing spend (often called MER).
- Cost per qualified lead and lead-to-sale rate for lead generation.
- Platform ROAS, kept as a diagnostic rather than the headline.
A dashboard that brings these together is explained in building a reliable marketing dashboard.
Putting it into practice
Start by agreeing margin figures with finance, then set a break-even ROAS and a target CAC per product line. Use those to set Smart Bidding targets and to decide budgets between channels - see Meta Ads vs Google Ads budget allocation.
Results like the 6.7x Google ROAS for PGH Apparel are most meaningful when read alongside branded search growth and new customer acquisition, not in isolation.
Questions to ask before scaling spend
- What is our contribution margin per order or per customer, after product cost, shipping, payment fees and returns?
- What is the highest CAC we can afford, and over what payback period?
- How much of current paid revenue comes from new customers versus returning ones?
- Which campaigns would we expect to keep working if paused for two weeks, because organic or direct demand would replace them?
- Do our lead conversions reflect what sales calls qualified, or just form fills?
- When did we last test incrementality, and what did we learn?
If the team cannot answer these, scaling budget is a gamble. Answering them usually takes a few days of work with finance and sales data, and it often changes which campaigns get more money.
Document the answers alongside your targets so new team members and agencies work from the same numbers.
Frequently asked questions
- What is a good ROAS?
- It depends on your margin. Calculate break-even ROAS as 1 divided by contribution margin; a good ROAS is comfortably above that after returns and fees.
- What is the difference between ROAS and MER?
- ROAS uses revenue attributed to a platform. MER (marketing efficiency ratio) divides total revenue by total marketing spend, avoiding attribution disputes.
- How often should I run incrementality tests?
- For most growing businesses, once or twice a year per major channel is realistic, plus whenever a large budget change is planned. Keep the setup consistent so results can be compared over time.
- How do I measure lead quality?
- Agree a definition of a qualified lead with sales, record it in your CRM, and import it as a conversion into ad platforms so you can see and optimise cost per qualified lead.
References and further reading
- About conversion lift - Google Ads Help
- About Smart Bidding - Google Ads Help
- Meridian marketing mix model - Google for Developers
- Performance Marketing
- CAC
- Incrementality
- Measurement
Related case studies
Want this applied to your brand?
Let's Talk